Score Overview
i
Marlow
iMarlow is practice management software for independent physiotherapy practices, combining scheduling, in-session notes and insurer-ready billing in one tool.
- Live in 11 practices across 3 countries since March 2026, with 6 named reference practices in NL, PL and DE
- Founder-market fit: CEO is a practising physiotherapist who ran a 4-therapist practice; CTO shipped v1 in six months; insurer claims-director advisor
- Clear, simple monetisation at €89/practice/month with a defined second revenue line (patient payments) and 80% gross margin assumption
Top Priority
iAdd a competitive landscape slide naming actual European physio and practice-management vendors (and the bookkeeper/billing-service status quo), with an explicit axis of differentiation - tablet-native notes during treatment plus built-in NL/DE/PL insurer claim formats for 1-4 therapist practices - and evidence (from the 38 interviews) of what each of the 11 live practices used before Marlow.
Competitive Landscape: 42/100
There is no competition slide at all across the 14 slides; the only competitive hint is an oblique reference to "a desktop tool from 2009" on the Why Now slide.
Target: 75+ / 100
Add a dedicated competition slide naming the real incumbents by market (e.g. the NL/DE physio practice suites and generic tools like Google Calendar + Excel) with a 2-axis map: small-practice fit vs insurer-claim depth
Critical Red Flags
iAction Plan
i- 1
Add competitive landscape slide
Slides 4, 5, 7medium effortActionInsert a new competition slide after Slide 4 naming actual European physio and practice-management vendors plus the spreadsheet/bookkeeper status quo, with an explicit axis: tablet-native notes during treatment + built-in NL/DE/PL insurer claim formats for 1-4 therapist practices.
Why it mattersThere is no competition slide across 14 slides; the only hint is an oblique 'desktop tool from 2009', which reads as either naivety or avoidance to any healthcare-software investor.
DeliverableOne 2x2 or feature-grid slide with named vendors, plus a line stating what each of the 11 live practices used before Marlow (from the 38 interviews).
Expected impactDirectly lifts the weakest dimension (Competitive Landscape 42/100) and defuses the 'incumbent adds a lightweight tier' objection.
- 2
Replace top-down TAM with bottom-up
Slides 4, 9medium effortActionSwap the €4.2bn all-healthcare TAM for a bottom-up SAM/SOM: count licensed physio, chiro and osteo practices per target country from the public registries you already cite on Slide 10, apply €89/month, and reconcile the practice-count path to €18m ARR by 2030.
Why it matters€18m at €89 ARPU implies roughly 17,000 practices - a number never stated or defended - while the TAM includes dentists and GPs with entrenched incumbents.
DeliverableRevised Slide 4 with named source, SAM and SOM figures; a practices-per-year row added beneath the Slide 9 ARR curve.
Expected impactRaises Market (62) and Financials (58) credibility and pre-empts 'what share of the market is that?'
- 3
Rebuild traction slide around metrics
Slides 7medium effortActionConvert the logo wall into a metrics slide: current MRR, paying vs trial practices, trial-to-paid conversion, logo/revenue retention since March 2026, and usage depth (tablet notes per week, % of invoices issued through Marlow).
Why it mattersAt seed the traction slide carries the most weight, and this one shows six names and zero numbers - investors will assume the numbers are unflattering.
DeliverableRedesigned Slide 7 with a monthly growth line and a small name strip beneath, labelled as practice names rather than logo artwork.
Expected impactLifts Traction & Metrics (66) and answers 'how many of the six are paying?' head-on.
- 4
Insert regulatory and data-protection slide
Slides 3, 6medium effortActionAdd a slide covering GDPR controller/processor model, hosting location, encryption and backup policy, record retention per country, and a stated position on e-health certification in DE/NL/PL - including whether the 2027 mandate is a gate or a free-tool threat.
Why it mattersSoftware holding patient notes and insurer claims in three countries currently names no actual regulation anywhere in the deck, while Slide 3 treats the 2027 mandate purely as tailwind.
DeliverableOne compliance slide plus a named-regulation source line added to Slide 3's first tailwind.
Expected impactLifts Regulatory & Compliance (62) and removes a diligence blocker for healthcare-focused funds.
- 5
Add unit economics and margin build
Slides 8, 10, 13medium effortActionAdd CAC, payback months and observed churn to Slide 8, a demo-to-paid funnel to Slide 10, and a gross margin build itemising SMS, hosting and support so the 80% at scale figure is defensible - then tie the 35% sales allocation to a practice-acquisition target toward 400.
Why it mattersAt €89 ARPU with an outbound calling motion, payback is the single thing an investor models first, and unmetered SMS plus hands-on support quietly erode the stated margin.
DeliverableA three-number economics strip on Slide 8, a funnel line on Slide 10, and a CAC/payback bridge under the Slide 13 ask.
Expected impactMakes the Financials and Business Model defensible under diligence and justifies the €1.2m allocation.
Top Strengths
i- Founder-market fit is unusually strong: Anna K. is a practising physiotherapist with eight years in a four-therapist Utrecht practice who ran its admin herself (the origin of the product), paired with a CTO who previously led a payments team at a Polish fintech and a product designer from a consumer app with two million users - plus advisors including a former NL insurer claims director and an exited DE healthcare software founder.
- Sharply specified, quantified problem grounded in primary research: 38 practice interviews in 2025 yielding concrete figures (6h/week admin per therapist, 23-day average visit-to-invoice gap) that map directly onto the three product pillars (scheduling, notes, billing) on one screen.
- Credible early commercial signal and a disciplined ask: live in 11 practices across NL, PL and DE since March 2026, a simple €89/practice/month price with transparent €19/extra-therapist expansion, and a €1.2m SAFE with €300k already committed from two Dutch healthcare angels, 18 months runway and a specific 6-person hiring plan.
Priority Fixes
i- 1Add a competitive landscape slide naming actual European physio and practice-management vendors (and the bookkeeper/billing-service status quo), with an explicit axis of differentiation - tablet-native notes during treatment plus built-in NL/DE/PL insurer claim formats for 1-4 therapist practices - and evidence (from the 38 interviews) of what each of the 11 live practices used before Marlow.
- 2Replace the €4.2bn all-healthcare TAM with a bottom-up SAM/SOM: count licensed physio, chiro and osteo practices per target country from the public registries you already cite, apply €89/month, and show the practice count path (and ARPU expansion) that reconciles to €18m ARR by 2030 - then state the ~17,000-practice implication explicitly or revise the forecast.
- 3Rebuild Slide 7 as a metrics slide: current MRR, trial-to-paid conversion, logo/revenue retention since March 2026, and usage depth per practice (tablet notes per week, % of invoices issued through Marlow vs. spreadsheet) - keep partner names as a secondary band, and clarify that the cards are names, not logo artwork.
- 4Insert a regulatory and data-protection slide: GDPR controller/processor model, hosting location, encryption and backup/data-loss policy, record retention obligations per country, and a stated position on e-health certification requirements in DE/NL/PL - including whether the 2027 mandate creates a certification gate or an insurer/association-funded free-tool threat.
- 5Add unit economics to the GTM and ask: CAC and payback from the demos already run, sales cycle length and close rate, and a gross margin build that itemises SMS, hosting and support so the 80% figure is defensible - then tie the 35% sales allocation to a concrete practice-acquisition target on the path to 400 practices.
Investor Readiness
iBlockers
- 1No competitive landscape slide - incumbents in physio practice software (e.g. established EU vendors) are not addressed and no moat is articulated
- 2Traction slide shows only customer logos, not metrics: no MRR/ARR, retention, churn, conversion from trial, or growth trend
- 3Unit economics missing - no CAC, payback, LTV or sales-cycle data to support the direct-sales GTM and €18m ARR path
Improvements for Next Level
- →Replace the logo wall with hard numbers: paying practices, MRR, MoM growth, trial-to-paid conversion and logo retention since March 2026
- →Add a competitive map versus existing physio/practice software vendors with explicit differentiation and defensibility (insurer formats, switching costs, data)
- →Ground the financial model bottom-up: practices acquired per rep per month, CAC and payback, ARPU expansion, and the assumptions behind 40% YoY growth and break-even timing
- →Quantify the €4.2bn TAM bottom-up (number of EU physio practices x €89/mo) and define SAM/SOM for the NL/PL beachhead
Fundraising Readiness Roadmap
Almost Ready for Seed roundNo competitive landscape slide - incumbents in physio practice software (e.g. established EU vendors) are not addressed and no moat is articulated
Traction slide shows only customer logos, not metrics: no MRR/ARR, retention, churn, conversion from trial, or growth trend
Unit economics missing - no CAC, payback, LTV or sales-cycle data to support the direct-sales GTM and €18m ARR path
Replace the logo wall on Slide 7 with a metrics panel: **practices live by month, paying vs trial, MRR today, trial-to-paid conversion rate, logo retention**
Add a dedicated competition slide naming the real incumbents by market (e.g. the NL/DE physio practice suites and generic tools like Google Calendar + Excel) with a 2-axis map: small-practice fit vs insurer-claim depth
Rebuild Slide 9 bottom-up: practices live x €89/month x (1 + add-on therapists), and show the implied practice count each year (e.g. ~17,000 practices at €18m ARR) so reviewers can sanity-check against the €4.2bn TAM
What Would Change an Investor's Mind
Radar Analysis
iCONTENT / NARRATIVE - SCORE 71 (Grade B)
Internal reference profile overlay
VISUAL ANALYSIS - SCORE 81 (Grade A-)
Internal reference profile overlay
Content & Narrative
i10-dimension analysis
Problem Statement
82The problem is specific, quantified and interview-validated - 6h/week of admin per therapist and a 23-day visit-to-invoice gap from 38 practice interviews - with a supporting owner quote later in the deck.
- Slide 2: 6h/week of admin per therapist in a two-person practice, sourced to own interviews, 38 practices, 2025
- Slide 2: 23 days average gap between a visit and the invoice for it - a quantified, specific pain metric
- Slide 2: Clear persona and before-state - practices run on paper, a calendar app and a spreadsheet, notes not searchable across visits
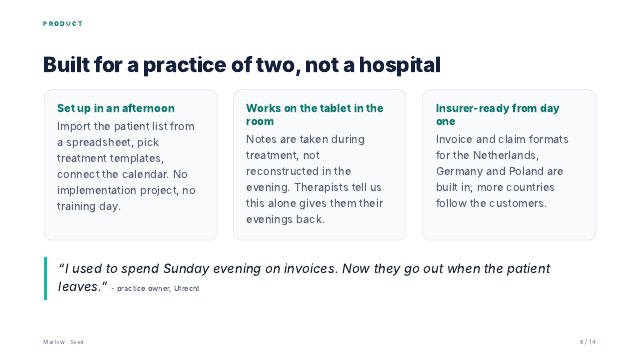
- Slide 6: Direct customer quote - "I used to spend Sunday evening on invoices. Now they go out when the patient leaves." (practice owner, Utrecht)
- Slide 2: Pain is quantified in hours and days but never in euros - no estimate of cash-flow cost or lost billable time value
- Slide 2: Interview data is self-reported with no detail on how many of the 38 said they would pay to fix it
- Slide 2: Text layout buries the metrics mid-paragraph, so the 6h/week and 23 days figures lose visual impact
- Convert the pain to money: e.g. "6h/week x €60/h billable = ~€15k/year of lost capacity per therapist" directly on Slide 2
- Move the Utrecht owner quote from Slide 6 onto the problem slide and add a second quote from a Polish or German practice
- Add a line from the 38 interviews on willingness to pay, e.g. "29 of 38 said they would pay up to €100/month to remove the evening note-writing"
Solution & Value Proposition
80A sharp one-line value prop - "One screen for the whole visit: book, treat, note, bill" - backed by a concrete UI mockup and 11 live practices, though the 10x improvement is asserted rather than measured.
- Slide 5: UVP in one sentence - "One screen for the whole visit: book, treat, note, bill", each element mapped to a Slide 2 pain
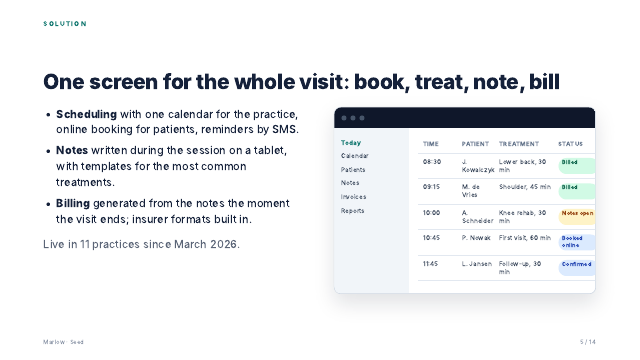
- Slide 5: Product UI mockup with real workflow states (Billed, Notes open, Booked online, Confirmed) rather than a generic hero image
- Slide 5: Live in 11 practices since March 2026 - product working with real users, not a concept
- Slide 6: Non-obvious insight - insurer and claim formats for NL, DE and PL built in from day one, plus setup in an afternoon, no training day
- Slide 5: No after-state metric - the deck never says the 23-day invoice gap fell to X days for the 11 live practices
- Slide 6: The strongest proof point ("therapists tell us this alone gives them their evenings back") is anecdotal, not measured hours saved
- Slide 6: No screenshot of the tablet note-taking experience, which is claimed as the single biggest benefit
- Add a before/after bar on Slide 5: "23 days to invoice -> 1 day across 11 live practices" to turn the value prop into a measured 10x claim
- Show a second screenshot of the in-session tablet note template, since that is the claimed killer feature
- State the time saved explicitly, e.g. "average 4.5h/week returned per therapist, measured across 11 practices"
Market Opportunity
62A single €4.2bn top-down TAM from an unnamed "industry report" with no SAM or SOM, partially rescued by a genuinely strong three-part Why Now argument.
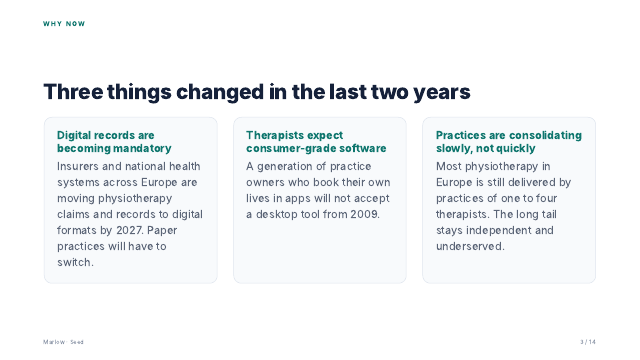
- Slide 3: Specific, dated catalyst - insurers and national health systems moving physiotherapy claims to digital formats by 2027, forcing paper practices to switch
- Slide 3: Credible structural tailwind - most European physiotherapy is still delivered by practices of one to four therapists, an underserved long tail
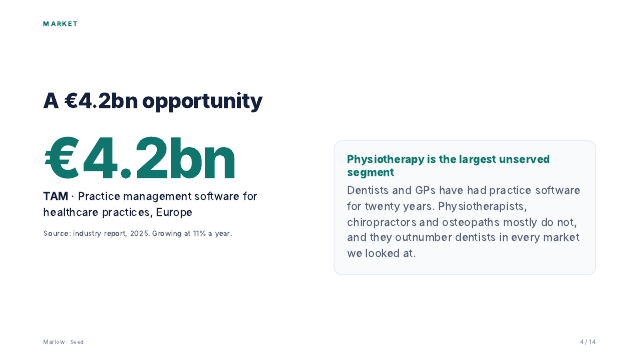
- Slide 4: Clear beachhead logic - physiotherapists, chiropractors and osteopaths outnumber dentists in every market examined yet lack practice software
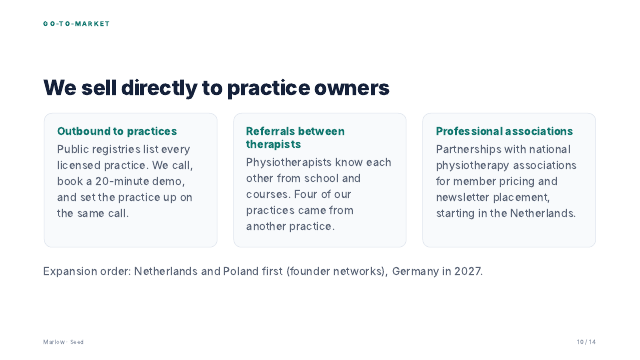
- Slide 10: Implicit beachhead definition - Netherlands and Poland first (founder networks), Germany in 2027
- Slide 4: TAM sourced to an unnamed "industry report, 2025" with no publisher, scope or methodology shown
- Slide 4: TAM is for all healthcare practices in Europe, not physiotherapy - the serviceable segment is never carved out
- Slide 4: No SAM or SOM anywhere in the deck, despite Slide 13's 400-practice goal making a bottom-up build easy
- Slide 4: The claim that physios outnumber dentists is asserted with no practice counts per market
- Replace the top-down figure with a bottom-up build: "~X0,000 physio practices in NL/PL/DE x €89-150/month = €Ym SAM", then extend to Europe
- Add a SOM line tied to the plan: "400 practices by 2027 = €0.4m ARR, <0.5% of SAM" to show the target is conservative
- Name the TAM source and date, and show the physiotherapy-only sub-segment separately from dentists and GPs
Business Model
71Pricing is concrete and well-structured (€89/practice/month up to 4 therapists, €19 per extra therapist, annual at two months free) with an 80% gross margin assumption, but there are no CAC, LTV or payback figures anywhere.
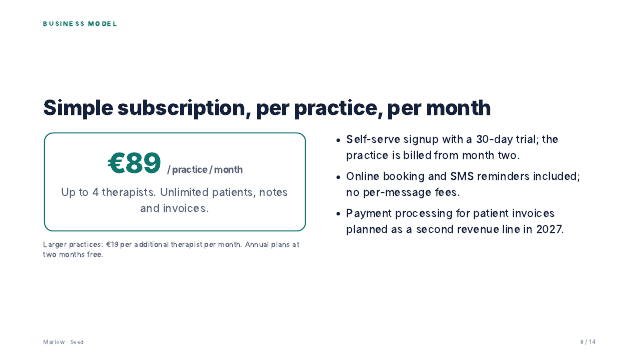
- Slide 8: Explicit pricing - €89/practice/month up to 4 therapists, €19 per additional therapist, annual plans at two months free
- Slide 8: Second revenue line identified with timing - patient invoice payment processing planned for 2027
- Slide 8: Deliberate packaging choice - online booking and SMS reminders included, no per-message fees, removing a common billing friction
- Slide 9: 80% gross margin at scale stated, comfortably above the SaaS threshold
- Slide 8: No CAC, LTV, payback period or churn stated anywhere in the deck
- Slide 10: Outbound calling plus live demo setup implies meaningful sales cost against a €89/month ARPU - the payback math is never addressed
- Slide 8: Pricing is stated but not justified - no reference to what practices pay today for calendar apps, bookkeeping or paper processes
- Slide 9: The 80% gross margin is an assumption at scale, not a current measured figure from the 11 live practices
- Add a unit economics box: "CAC €X from outbound, €1,068 ARR per practice, payback N months, LTV/CAC N:1" using data from the 11 live practices
- Justify €89 by anchoring to the alternative: "replaces a €40 calendar app plus 6h/week of admin worth €1,200/month"
- State early churn/retention from the March 2026 cohort, even if the sample is small, and show expansion revenue from the €19 per-therapist upsell
Traction & Metrics
6611 live practices since March 2026 and 6 named partner practices across 3 countries are real signals, but there is no revenue figure, no growth rate and no retention data - and Slide 7 presents logos as traction without metrics.
- Slide 5: Live in 11 practices since March 2026 - real deployed users, not a waitlist
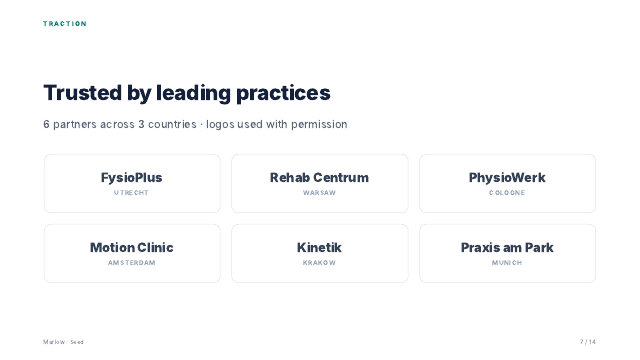
- Slide 7: 6 named partner practices across 3 countries (FysioPlus Utrecht, Rehab Centrum Warsaw, PhysioWerk Cologne, Motion Clinic Amsterdam, Kinetik Krakow, Praxis am Park Munich), used with permission
- Slide 10: Organic PMF signal - four of the practices came from a referral by another practice
- Slide 6: Qualitative retention signal - Utrecht owner reports invoices now go out when the patient leaves
- Slide 7: The traction slide shows only names and cities - zero metrics, no MRR, no usage, no retention
- Slide 5: No disclosure of how many of the 11 practices are paying versus still in the 30-day trial
- Slide 7: No month-on-month growth trend - 11 practices in roughly 2-3 months is stated as a point, not a curve
- Slide 9: €0.1m for 2026 is a projection, not booked ARR, so no actual revenue figure appears anywhere in the deck
- Replace the logo wall on Slide 7 with a metrics panel: practices live by month, paying vs trial, MRR today, trial-to-paid conversion rate, logo retention
- State current booked MRR explicitly (e.g. "€780 MRR from 9 paying practices, up from 2 in March") - small real numbers beat none
- Add one engagement metric that proves the product is used, such as "% of visits with notes completed in-session" or "average days from visit to invoice, now X"
- Note the referral ratio as a formal metric: "4 of 11 practices (36%) acquired by referral, CAC €0"
Competitive Landscape
42There is no competition slide at all across the 14 slides; the only competitive hint is an oblique reference to "a desktop tool from 2009" on the Why Now slide.
- Slide 3: Acknowledges the status quo alternative - therapists "will not accept a desktop tool from 2009" - implying legacy incumbents exist
- Slide 6: "Built for a practice of two, not a hospital" is a clear segment-level differentiation axis vs enterprise/hospital systems
- Slide 6: Insurer and claim formats for the Netherlands, Germany and Poland "built in" is a latent regulatory/integration moat
- Slide 4: Frames physiotherapy as "the largest unserved segment" vs dentists and GPs who "have had practice software for twenty years"
- Slide 4 (or missing slide): No competitive landscape slide anywhere in the 14-slide deck - no named competitors in NL, DE or PL
- Slide 2: The stated incumbent is "paper, a calendar app and a spreadsheet" - implies the deck treats non-consumption as the only competitor, close to a 'no competition' claim
- Slide 8: €89/practice/month pricing is presented with no competitive price benchmark, so it is impossible to judge positioning
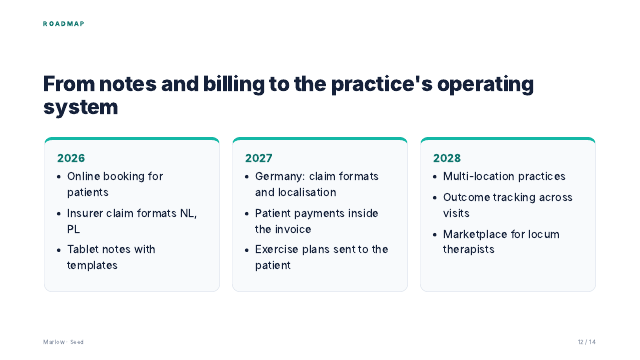
- Slide 12: Roadmap (payments, exercise plans, locum marketplace) is not framed against what competitors already ship
- Slide 11: Advisors include a former insurer claims director (NL), but no moat argument is built from that access
- Add a dedicated competition slide naming the real incumbents by market (e.g. the NL/DE physio practice suites and generic tools like Google Calendar + Excel) with a 2-axis map: small-practice fit vs insurer-claim depth
- Quantify the switching-cost and data moat: state how many insurer claim formats are certified and how long a new entrant would need to replicate NL+DE+PL coverage
- Add a price/feature comparison row under Slide 8 showing €89/practice/month vs named alternatives' per-seat pricing
- State win/loss evidence from the 11 live practices: what were they using before Marlow, and what did Marlow displace
Team & Founders
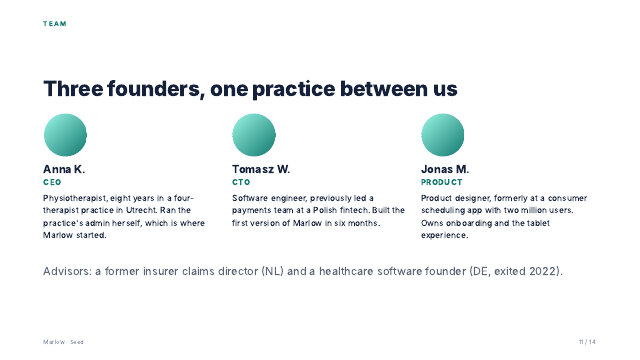
80A credible, complementary three-founder team: Anna K. (CEO) is a practising physiotherapist with eight years in a four-therapist Utrecht practice, Tomasz W. (CTO) is an engineer who led a payments team at a Polish fintech, and Jonas M. (Product) is a consumer product designer.
- Slide 11: CEO Anna K. is a physiotherapist with eight years in a four-therapist Utrecht practice and ran the practice admin herself - direct domain expertise and founder-market fit
- Slide 11: CTO Tomasz W. is a software engineer who previously led a payments team at a Polish fintech and built the first version of Marlow in six months
- Slide 11: Jonas M. (Product) is a product designer formerly at a consumer app with two million users, owning onboarding and the tablet experience
- Slide 11: Advisors include a former insurer claims director (NL) and a healthcare software founder (DE) who exited in 2022
- Slide 10: Expansion order into the Netherlands and Poland is explicitly justified by founder networks
- Slide 11: Founders are identified only by first name and initial (Anna K., Tomasz W., Jonas M.) with no company names or LinkedIn references - hard to diligence
- Slide 11: Portraits are abstract teal gradient placeholders rather than real photos, which reads as unfinished for a seed deck
- Slide 11: No founder has a prior startup exit; the only exit cited belongs to an advisor
- Slide 13: Six hires planned (three engineering, two sales, one support) but no named key hires or leadership gaps acknowledged
- Slide 6: Insurer-ready claims across NL/DE/PL implies regulatory and health-data compliance work, yet no compliance or regulatory lead is identified on the team slide
- Add full names, prior employers and years of experience for each founder, plus LinkedIn links - anonymised bios undermine credibility at seed
- Replace gradient placeholder avatars with real headshots and add the advisors' names and former institutions
- Name the planned first key hire (e.g. a regulatory/compliance or insurer-integrations lead) and tie it to the Slide 13 hiring plan
- Add one line of founder execution proof: e.g. the 11 live practices were signed by Anna K. directly in X weeks
Financial Projections
58A five-year ARR curve to €18m by 2030 with only two stated assumptions (40% YoY growth from 2027, 80% gross margin at scale) - and the curve visibly contradicts the stated growth rate.
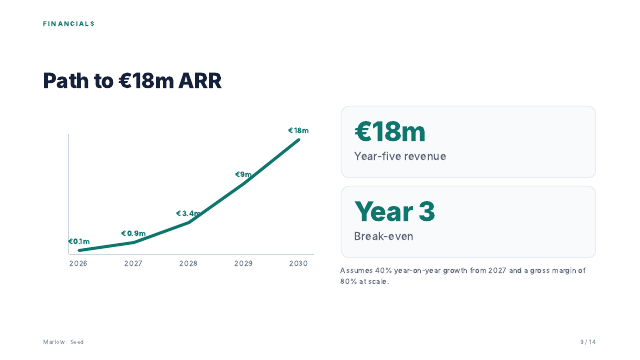
- Slide 9: Five-year ARR projection presented by year (2026 €0.1m, 2027 €0.9m, 2028 €3.4m, 2029 €9m, 2030 €18m)
- Slide 9: Two assumptions are at least stated - 40% YoY growth from 2027 and 80% gross margin at scale
- Slide 9: A break-even point is explicitly marked in Year 3
- Slide 8: Clear, simple revenue model (€89/practice/month, €19 per additional therapist) that could anchor a bottom-up model
- Slide 8: A second revenue line (patient payment processing) is flagged for 2027
- Slide 9: The stated "40% year-on-year growth" is inconsistent with the plotted curve, which implies 100-278% annual growth from 2027-2030
- Slide 9: No bottom-up build - practice count, ARPU, CAC, churn and payback are all absent despite the simple per-practice pricing on Slide 8
- Slide 9: Chart has no y-axis labels and no cost, burn or headcount lines; break-even in Year 3 is asserted without a cost base
- Slide 13: €1.2m for 18 months implies roughly €67k/month burn, but this is never reconciled with the Slide 9 revenue plan
- Slide 8: Payments revenue planned for 2027 is not shown as a separate line in the 2027-2030 projection
- Rebuild Slide 9 bottom-up: practices live x €89/month x (1 + add-on therapists), and show the implied practice count each year (e.g. ~17,000 practices at €18m ARR) so reviewers can sanity-check against the €4.2bn TAM
- Fix the growth-rate contradiction - either restate the actual implied CAGR or correct the curve
- Add CAC, gross churn and payback period from the 11 live practices, plus a cost/burn line so break-even in Year 3 is demonstrable
- Show a base and downside scenario, and split subscription vs payments revenue from 2027
Ask & Use of Funds
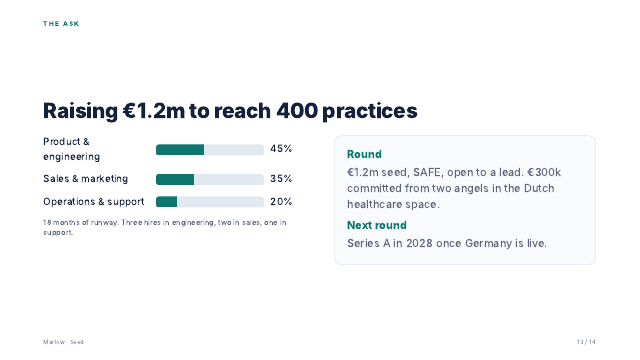
80A clean, specific ask: €1.2m seed on a SAFE, €300k already committed from two Dutch healthcare angels, 18 months of runway, a percentage allocation and a named milestone of 400 practices.
- Slide 13: Specific ask of €1.2m seed on a SAFE, open to a lead
- Slide 13: €300k already committed from two Dutch healthcare angels - early validation and momentum
- Slide 13: Clear allocation - Product & engineering 45%, Sales & marketing 35%, Operations & support 20%
- Slide 13: 18 months of runway with a concrete hiring plan of three engineering, two sales, one support
- Slide 13: Milestone-linked headline ("to reach 400 practices") and a next-round trigger (Series A in 2028 once Germany is live)
- Slide 13: The 400-practice milestone is not dated or reconciled with the 18-month runway, nor with the €0.9m 2027 ARR on Slide 9 (400 practices at €89/month is roughly €0.43m ARR)
- Slide 13: Allocation percentages are given without justification - no cost per hire, no CAC-based sales budget rationale
- Slide 13: Series A timing in 2028 sits beyond the stated 18-month runway from a Spring 2026 raise, leaving a possible gap
- Slide 13: No prior raise history or capital efficiency data (how the 11 live practices on Slide 5 were reached and on what capital)
- Slide 12: Roadmap items (payments, locum marketplace) extend to 2028 but are not mapped to the funded 18-month period
- Add interim milestones with dates: e.g. 'Month 6: 120 practices; Month 12: 250; Month 18: 400 practices and €0.45m ARR, Germany claim formats live'
- Justify the 35% sales allocation with a CAC figure from the existing 11 practices and the implied number of new practices it buys
- Reconcile the 400-practice target with the Slide 9 2027 ARR figure, or explain the ARPU uplift (additional therapists, payments) that closes the gap
- State prior capital raised to date and burn so far to demonstrate capital efficiency
Storytelling & Design
72A tight 14-slide arc (problem to why now to market to solution to traction to model to ask) with a clean teal visual language, let down by placeholder assets and a weak traction slide.
- Slide 2: Pain is quantified and sourced - 6h/week admin per therapist and a 23-day visit-to-invoice gap from interviews with 38 practices in 2025
- Slide 5: Realistic product UI mockup with colour-coded status chips (Billed, Notes open, Booked online, Confirmed) makes the solution immediately legible
- Slide 6: Customer quote from a practice owner in Utrecht anchors the benefit emotionally
- Slide 14: Strong closing line "Every practice, out of the paper age" with a direct contact email
- Slide 1-14: Consistent footer pagination and teal visual language across a disciplined 14-slide length
- Slide 7: Claims "logos used with permission" but partners are rendered as plain text cards - no actual logo artwork, undermining the "Trusted by leading practices" header
- Slide 7: Traction slide shows only partner names and cities - no revenue, retention or usage numbers, so the strongest narrative beat is the weakest slide
- Slide 11: Founder portraits are abstract gradient circles instead of real photos
- Slide 9: The ARR chart has no y-axis labels, making the curve hard to read as data
- Slide 2: Text layout appears interleaved/jumbled (the 6h/week stat is spliced mid-sentence), suggesting broken column flow
- Replace Slide 7 text cards with real partner logos, and add hard traction metrics: MRR, practices live (11 since March 2026), retention and therapist seats
- Add real founder headshots on Slide 11 and full names to match the professionalism of the rest of the deck
- Label the y-axis on Slide 9 and overlay practice count so the chart reads as a model, not a shape
- Fix the column flow on Slide 2 so the 6h/week and 23-day statistics sit as standalone stat blocks rather than splicing the body copy
Regulatory & Compliance
62The deck shows implicit regulatory awareness - insurer claim formats for NL/DE/PL and a mandatory digital records driver by 2027 - but names no actual regulation (GDPR, EU MDR, NIS2, national e-health standards) and provides no compliance plan, owner, or timeline for a vertical handling patient health data across three jurisdictions.
- Slide 3: 'Insurers and national health systems across Europe are moving physiotherapy claims and records to digital formats by 2027' - regulatory shift framed as the core Why Now driver
- Slide 6: 'Insurer-ready from day one - invoice and claim formats for the Netherlands, Germany and Poland are built in' indicates concrete payer-format compliance work already done
- Slide 11: Advisor is a former insurer claims director (NL), giving some reimbursement-regime expertise at the advisory level
- Slide 10: go-to-market references public registries listing every licensed practice, showing awareness of professional licensing structures
- Slide 6: Product stores patient treatment notes across NL, PL and DE with no mention of GDPR, data residency, encryption or PHI handling - a major omission for a health-data product
- Slide 12: Roadmap lists Germany claim formats and localisation for 2027 but contains no compliance, certification or data-protection milestones
- Slide 11: No compliance officer, DPO or regulatory counsel named on the team or advisory bench
- Slide 13: €1.2m use of funds (45% product, 35% sales, 20% ops) allocates no budget line to regulatory or certification work despite a three-country footprint
- Slide 5: Online patient booking and SMS reminders involve patient-identifiable data with no stated consent or data-processing approach
- Add a compliance slide naming the specific regimes: GDPR Art. 9 (special category health data), Dutch NEN 7510/7512, German gematik/TI requirements and Polish health data rules, with the status of each
- State explicitly whether Marlow is classified as a medical device under EU MDR or falls outside it as administrative software, and cite the reasoning
- Name a DPO or data-protection advisor and state where patient data is hosted (EU region, sub-processors, encryption at rest and in transit)
- Add compliance milestones to the Slide 12 roadmap - e.g. 'ISO 27001 / NEN 7510 certification by Q4 2027' - with an owner and cost estimate in the Slide 13 budget
- Replace the vague 'mandatory by 2027' claim on Slide 3 with the named directive or national programme driving it
IP & Technical Defensibility
47Marlow presents no patents, no proprietary dataset and no hard-tech claim - the moat rests on vertical focus, ease of setup and pre-built insurer claim formats, which are workflow advantages rather than defensible technology.
- Slide 6: Insurer claim formats for NL, Germany and Poland built in - multi-country payer integration work that is genuinely time-consuming to replicate
- Slide 11: CTO Tomasz W. built the first version of Marlow in six months and previously led a payments team at a Polish fintech, indicating real execution capability
- Slide 5: Clear, specific product description (one calendar, tablet notes with treatment templates, billing generated from notes) rather than vague 'proprietary platform' language
- Slide 1-14: No patents, filings or IP strategy mentioned anywhere in the deck
- Slide 12: Outcome tracking across visits is a 2028 roadmap item - the one potential proprietary dataset does not yet exist
- Slide 4-5: No competition slide; the deck never explains why an incumbent dental/GP practice-software vendor could not add a physio module
- Slide 6: Core differentiators - setup in an afternoon, tablet notes, templates - are product polish, not technical barriers, and are replicable by a funded competitor
- Slide 8: €89/practice/month subscription with no stated switching-cost or data lock-in argument to defend against price competition
- Quantify the claim-format moat: state how many insurer formats are implemented per country and the engineering months each required, framing it as a compounding integration barrier
- Add a competition slide naming the actual incumbents (e.g. legacy desktop physio tools, generic practice-management suites) with a positioning matrix on vertical depth vs. ease of setup
- Articulate the data flywheel: once patient history, notes and claims live in Marlow, switching means re-keying years of records - state measured churn or retention from the 11 live practices to prove it
- Pull outcome tracking forward and position the anonymised treatment-outcome dataset as a future proprietary asset with a stated data-rights clause in customer contracts
- If any element (e.g. notes-to-claim auto-generation) is novel, note whether a filing has been considered; otherwise state explicitly that the moat is distribution and integration depth, not IP
Visual & Design
i7-dimension visual pass
Visual Hierarchy
84A disciplined system of small teal eyebrow labels (PROBLEM, MARKET, THE ASK) above large navy headlines guides the eye consistently, and oversized teal stat numbers like €4.2bn and 6 h / week act as strong focal anchors.
- Slide 4 uses a huge teal €4.2bn as the dominant element with supporting TAM caption beneath - unmistakable focal point
- Slide 2 pairs a left bullet column with two right-hand grey stat cards (6 h/week, 23 days), creating a clear primary/secondary split
- Slide 9 places the €18m and Year 3 stat cards at equal weight to the chart, reinforcing the headline claim
- Slide 5's product screenshot competes with the bullet list; neither is clearly dominant and the mockup is cropped at the right edge
- Slide 7 headline 'Trusted by leading practices' is louder than the actual evidence - the six name cards are visually flat and uniform
- Slide 13 allocation bars are small and sit low-contrast against the right-hand Round card, which pulls attention first
- On slide 5, enlarge the UI mockup to ~60% width and reduce bullets to three short bold keywords (Schedule / Note / Bill) with one line each
- On slide 7, add a headline metric such as '11 practices live · 6 named partners' in large teal type above the logo grid
- Give slide 13's budget bars more height (12-16px) and label each with the euro amount, not just percentage
Readability
79Clean sans-serif typography in navy on white with generous line spacing reads well, but several body blocks - especially the three-column cards and the table mockup - drop to ~11px equivalent that would be unreadable from 3 meters.
- Headlines are set large and bold in near-black navy, high contrast against white - legible at distance on slides 2, 3, 5, 10, 12
- Slide 1 and 14 use oversized white type on dark teal/navy backgrounds with excellent contrast
- Stat cards use large teal numerals with grey supporting captions at clear size differential
- Slide 5's schedule table text (patient names, treatments, status chips) is tiny and would be illegible when projected
- Footnotes on slides 4, 8, 9, 13 are set in very light grey at small size - low contrast, effectively invisible
- Three-column card text on slides 3, 6, 10 runs 5-6 lines of small grey copy per card
- Increase the footer footnote grey from light (#9aa) to a mid grey (#5a6b70) and bump one point size
- Trim each card on slides 3/6/10 to a bold claim plus max 2 lines of supporting text
- Zoom the slide 5 mockup to show only 3 rows at larger scale rather than 5 cramped rows
Layout
85A consistent left-aligned grid with a shared top eyebrow and bottom footer holds the deck together, with generous whitespace and well-balanced two-column and three-card arrangements.
- Uniform margins and a 'Marlow · Seed' left / page number right footer on every content slide (2-13)
- Three-card grids on slides 3, 6, 10, 12 are evenly gutter-spaced with equal card heights
- Slide 2 and 4 use a comfortable 50/50 split with the right-hand grey rounded cards aligned to the headline baseline
- Large empty bottom zones on slides 3, 4, 8, 10, 13 make slides feel top-heavy rather than deliberately airy
- Slide 5's browser-chrome mockup bleeds past the right margin, breaking the otherwise strict grid
- Slide 4's left column ends abruptly, leaving an awkward vertical imbalance against the taller right card
- Vertically center content blocks on sparse slides (4, 8, 13) or add a supporting footnote band to close the bottom gap
- Fully contain the slide 5 mockup inside the right margin with a soft drop shadow
- Add a single proof line under slide 4's TAM (e.g. 'SAM: 120k practices in NL/DE/PL') to balance the column
Consistency
91Exceptionally consistent system: one typeface family, a strict palette of deep teal (#0d6b5e), navy (#131a2e), light grey cards (#f5f7f8) and white, applied identically across all 14 slides.
- Teal is used only for accents, stats and section labels; navy only for headlines - no palette drift anywhere
- Rounded-corner grey cards reused identically on slides 2, 3, 4, 6, 9, 10, 12, 13
- Bookend slides 1 and 14 share the same 'marlow' dot wordmark lockup
- Slide 12's roadmap cards add a teal top rule not used on any other card family, and slide 8's price card uses a teal outline instead of grey fill
- Slide 6's pull-quote uses italic type not seen elsewhere in the deck
- Team avatars on slide 11 are gradient placeholder circles, inconsistent with the otherwise finished look
- Standardise one card style (grey fill) and use the teal top rule only where it signals a meaningful category
- Replace the gradient avatar blobs with real headshots cropped to the same circle size
- Keep the italic treatment but reuse it for at least one more customer quote so it reads as a system element
Data Visualization
68Only one real chart exists - the teal ARR curve on slide 9 - and while it is clean and point-labelled, most metrics elsewhere are presented as big numbers in cards rather than visualized comparisons.
- Slide 9's line chart labels each year's value (€0.1m, €0.9m, €3.4m, €9m, €18m) directly on the curve with no legend needed
- Slide 13 uses horizontal teal progress bars for use of funds (45/35/20%), an effective simple visual
- Slide 5 includes a realistic product table with colour-coded status chips (Billed green, Notes open amber, Booked online blue, Confirmed)
- No y-axis labels or gridlines on slide 9 - the curve's steepness is unverifiable and reads as a generic hockey stick
- Traction (slide 7) has zero charted data: no MRR, retention or practice growth curve, only a logo grid
- Market slide 4 shows a single number with no TAM/SAM/SOM visualization or growth trend
- Add a labelled y-axis (€m) and mark actuals vs. forecast with a solid-to-dashed line break at 2026 on slide 9
- Replace or supplement slide 7 with a monthly-practices-live bar chart since March 2026 plus MRR and churn figures
- Turn slide 4 into nested TAM/SAM/SOM blocks showing the physiotherapy sub-segment as a quantified slice of €4.2bn
Credibility Signals
70The deck signals credibility through named partner practices across six cities and three countries and explicit sourcing, but weakens it with text-only 'logos', placeholder avatars and an unnamed industry report.
- Slide 7 names FysioPlus (Utrecht), Rehab Centrum (Warsaw), PhysioWerk (Cologne), Motion Clinic (Amsterdam), Kinetik (Krakow), Praxis am Park (Munich) with 'logos used with permission'
- Slide 2 cites primary research: 'our interviews, 38 practices, 2025'
- Slide 11 lists advisors - a former insurer claims director (NL) and a healthcare software founder (DE, exited 2022)
- The 'logo' cards are set type, not actual logos - undermining the 'logos used with permission' caption
- Founder photos are abstract teal gradient circles; no faces, no LinkedIn-level credibility
- Slide 4 sources TAM to an unnamed 'industry report, 2025' with no publisher cited
- Swap in real partner logo artwork on slide 7, or relabel the slide as 'Live practices' to match the evidence shown
- Add professional headshots plus prior-employer logos (Polish fintech, consumer scheduling app) on slide 11
- Name the market report publisher and year directly in the slide 4 source line
Narrative Flow
87A textbook investor sequence - hook → problem → why now → market → solution → product → traction → model → financials → GTM → team → roadmap → ask → closing line - reinforced by visible section eyebrows that act as chapter markers.
- Slide 3 'Why now' sits between problem and market, pre-empting the timing objection with the 2027 digital-records mandate
- Slide 14 closes with a bold statement, contact email and city - a clean CTA bookend to the slide 1 title
- Page counters (2/14 … 14/14) give the reader a clear sense of progression
- Traction (slide 7) arrives after solution but shows only partner names - the '11 practices live since March 2026' proof is buried as a grey line on slide 5
- No competition slide anywhere in the arc, a visible gap for a category with incumbent practice-management tools
- The closing CTA offers an email but no explicit next step (e.g. 'book a 30-minute data room walkthrough')
- Promote the '11 practices live' metric to a large stat card at the top of slide 7
- Insert a competitive positioning slide between slides 7 and 8 using the existing three-card grid style
- Add a one-line ask-and-action under the slide 14 email, e.g. 'Lead the €1.2m SAFE - data room available on request'
Missing Content
i8 itemsKnow Your Business
KYBi- Slide 8: Pricing is concrete and legible - €89/practice/month for up to 4 therapists, €19 per additional therapist, 30-day trial, annual plans at two months free, showing the founder has made real packaging decisions rather than hand-waving.
- Slide 8 & 12: A second revenue line (patient payment processing in 2027) is identified and sequenced into the roadmap, suggesting awareness that a €89 ARPU SaaS needs expansion revenue to be venture-scale.
- Slide 11: Founder-market fit is operational, not theoretical - the CEO is a practising physiotherapist who ran the admin of a four-therapist practice in Utrecht, and the CTO shipped v1 in six months.
- Slide 13: Use of funds is broken down (45% product, 35% sales, 20% ops), with €300k committed, 18 months runway, and a named milestone of 400 practices.
- Slide 7: The traction slide shows six logos and zero metrics - no MRR, trial-to-paid conversion, churn, or expansion revenue - which for a company live in 11 practices is a conspicuous omission rather than an accident.
- Slide 9: The €18m ARR by 2030 path assumes 40% YoY growth and 80% gross margin with no bridge from €89/month to practice count - at €89 ARPU, €18m implies roughly 17,000 practices, a number never stated or defended.
- Slide 10 & 13: A direct outbound sales motion with 20-minute demos is proposed with no CAC, payback period, sales cycle length, or close rate - yet 35% of the raise is allocated to it.
- Slide 8: SMS reminders included with no per-message fees sits awkwardly against an 80% gross margin assumption; SMS, hosting, and support for non-technical practices are real COGS that are never quantified.
Know Your Customer
KYCi- Slide 2: The pain is quantified from primary research - 6h/week of admin per therapist and a 23-day average gap between visit and invoice, sourced from 38 practice interviews in 2025, which is far above seed-stage norms.
- Slide 6: The customer quote ("I used to spend Sunday evening on invoices", practice owner, Utrecht) captures the emotional trigger - evenings lost - rather than a generic efficiency claim.
- Slide 6: Product decisions map directly to customer constraints: setup in an afternoon, spreadsheet patient import, no implementation project, no training day - evidence of knowing that a two-person practice has no IT capacity.
- Slide 10: Four of the current practices came from another practice, showing the founder has observed a real peer-referral behaviour among therapists rather than assuming virality.
- Slide 2 & 8: The 38 interviews establish pain but never willingness to pay - there is no evidence of what practices currently spend on software, or why €89/month rather than €49 or €149.
- Slide 2: The patient - who books online, receives SMS reminders, and will eventually pay through the invoice in 2027 - is never characterised at all, despite being central to the second revenue line.
- Slide 6: Switching cost is invisible: nothing addresses what happens to a practice with years of existing patient history, insurer audit trails, or an incumbent contract - only a spreadsheet import is mentioned.
- Slide 5: Live in 11 practices since March 2026 is presented without usage depth - how many therapists write notes on the tablet daily, how many invoices actually flow through Marlow versus the old spreadsheet.
Know Your Environment
KYEi- Slide 3: The why now argument is specific and checkable - insurers and national health systems moving physiotherapy claims to digital formats by 2027, plus a generational shift away from desktop tools from 2009.
- Slide 3: Correctly identifies the structural market shape - most European physiotherapy is delivered by practices of one to four therapists, a long tail that is independent and underserved.
- Slide 11: Advisory bench shows environmental awareness: a former insurer claims director (NL) and a healthcare software founder (DE, exited 2022) map to the two hardest external dependencies.
- Slide 10: Expansion sequencing is grounded in founder networks (NL and PL first) with Germany in 2027, rather than a generic 'Europe' claim.
- Slide 4: There is no competitive landscape slide anywhere in 14 slides - established EU physio and practice-management vendors are never named, and the claim that physiotherapists 'mostly do not' have software is asserted, not evidenced.
- Slide 4: The €4.2bn TAM is practice management software for all healthcare practices in Europe - a market that explicitly includes dentists and GPs who already have incumbents - so the serviceable market for small physio practices is wildly overstated.
- Slide 1 & 6: No mention of GDPR, health-data processing, national e-health certification (e.g. German TI/KBV-style requirements), or medical record retention law - for software holding patient notes in three countries this is the single largest regulatory blind spot.
- Slide 3: The mandatory digital records by 2027 tailwind is also a threat - it can trigger certification requirements and invite insurer-sponsored or association-sponsored free tools, a scenario never considered.
Non-Obvious Risk Factors
iBlack Swans
iReference Profile Comparison
How your deck compares to internal investor-readiness reference profiles
Competitive Landscape
iAI-researched competitors are based on public knowledge - verify positioning independently
Competitive Landscape
42/100There is no competition slide at all across the 14 slides; the only competitive hint is an oblique reference to "a desktop tool from 2009" on the Why Now slide.
- Slide 3: Acknowledges the status quo alternative - therapists "will not accept a desktop tool from 2009" - implying legacy incumbents exist
- Slide 6: "Built for a practice of two, not a hospital" is a clear segment-level differentiation axis vs enterprise/hospital systems
- Slide 6: Insurer and claim formats for the Netherlands, Germany and Poland "built in" is a latent regulatory/integration moat
- Slide 4: Frames physiotherapy as "the largest unserved segment" vs dentists and GPs who "have had practice software for twenty years"
- Slide 4 (or missing slide): No competitive landscape slide anywhere in the 14-slide deck - no named competitors in NL, DE or PL
- Slide 2: The stated incumbent is "paper, a calendar app and a spreadsheet" - implies the deck treats non-consumption as the only competitor, close to a 'no competition' claim
- Slide 8: €89/practice/month pricing is presented with no competitive price benchmark, so it is impossible to judge positioning
- Slide 12: Roadmap (payments, exercise plans, locum marketplace) is not framed against what competitors already ship
- Slide 11: Advisors include a former insurer claims director (NL), but no moat argument is built from that access
- Add a dedicated competition slide naming the real incumbents by market (e.g. the NL/DE physio practice suites and generic tools like Google Calendar + Excel) with a 2-axis map: small-practice fit vs insurer-claim depth
- Quantify the switching-cost and data moat: state how many insurer claim formats are certified and how long a new entrant would need to replicate NL+DE+PL coverage
- Add a price/feature comparison row under Slide 8 showing €89/practice/month vs named alternatives' per-seat pricing
- State win/loss evidence from the 11 live practices: what were they using before Marlow, and what did Marlow displace
The single largest gap in this deck is that across 14 slides, not one competitor is named. For a category as mature as practice-management software in the Netherlands, Germany and Poland, that reads as either naivety or avoidance - and investors will assume the latter. The load-bearing claim on Slide 4, that physiotherapists "mostly do not" have practice software, is asserted, never evidenced, and it is the premise the entire opportunity rests on. If even a third of Dutch physio practices already run incumbent scheduling-and-billing tools, the wedge narrows from greenfield to rip-and-replace, and the €89/month self-serve motion becomes a switching-cost fight rather than a digitisation story.
The differentiation that is articulated is genuinely good and under-sold: notes taken on a tablet during treatment, billing generated the moment the visit ends, insurer claim formats for NL, DE and PL built in, and setup in an afternoon with no implementation project. That last point is a real moat against enterprise EHRs, and the multi-country claim-format library is the most durable asset here - tedious, regulatory, compounding. But the deck never frames it as a moat; it buries it as a feature bullet.
Two further exposures: the roadmap collides with adjacent incumbents - patient payments puts Marlow against PSPs, exercise plans against prescription apps, a locum marketplace against staffing platforms - with no acknowledgement of any of them. And Slide 3's "mandatory digital records by 2027" is presented purely as tailwind, when the same mandate typically triggers national certification burdens and invites insurer- or association-sponsored free tooling that can price a €89 subscription out of existence. No GDPR or health-data position appears anywhere.
Sector Insights
iHealthtech / Medtech
As a Healthtech / Medtech startup, investors weigh "Team & Founders" more heavily - you scored 80/100
Your Healthtech / Medtech-critical dimensions are solid - focus on overall polish
Narrative Review
iThe arc is clean, linear and unusually disciplined for a seed deck: a sharply observed problem, a credible why-now, a single-screen solution, early customers, a simple price, and a modest ask. It opens not with a grand vision but with a specific indignity - notes written after hours, invoices sent weeks late - and the two anchor numbers (6h/week of admin per therapist, a 23-day visit-to-invoice gap, drawn from 38 practice interviews) do real persuasive work because they are primary research, not a McKinsey slide. The quote from the Utrecht practice owner ("I used to spend Sunday evening on invoices") is the emotional peak of the deck and lands precisely because it is small and human rather than world-changing.
Where conviction stalls is the middle third. Slide 4 pivots from a tightly-scoped physio insight to a €4.2bn TAM covering all European healthcare practice management software - dentists and GPs included - which is exactly the segment the deck just argued Marlow is not serving. That is a narrative self-contradiction, and a sophisticated reader notices it immediately. Slide 7, labelled TRACTION, contains six practice names and zero numbers: no MRR, no trial-to-paid conversion, no churn, no usage depth, despite the product being live in 11 practices since March 2026. Calling six logos "trusted by leading practices" when they are two-to-four-therapist clinics strains the frame and makes the omission of metrics look deliberate rather than early.
The financial slide then asks for a leap of faith it never earns: €18m ARR by 2030 at €89/practice/month implies roughly 17,000 practices, a figure the deck never states or defends, and the 80% gross margin sits uneasily beside unmetered SMS, hands-on onboarding and three divergent insurer claim formats.
The close recovers. The ask - €1.2m SAFE, €300k already committed from two Dutch healthcare angels, 18 months runway, six named hires, Series A in 2028 once Germany is live - is specific, proportionate and milestone-linked. The closing line, "Every practice, out of the paper age," is memorable. Net: a credible, honest, under-quantified story that would convert far better with one real metrics slide and a defensible bottom-up market build.
Narrative Flow
iCoherence: 74/100A tight problem-to-solution arc: quantified admin pain from 38 practice interviews, three timing tailwinds, a one-screen product, then model, financials, GTM, team and a disciplined €1.2m ask. The chain breaks where competition and evidence should sit - market size is asserted top-down and traction is a logo wall.
Category and buyer are clear within two seconds; a traction line would strengthen it.
Workflow chain with 6h/week and 23-day anchors follows the cover naturally.
Three tailwinds build logically on the pain, though no regulation is named.
A single top-down €4.2bn TAM from an unnamed report weakens an otherwise strong setup.
Maps one-to-one onto the problem - book, treat, note, bill - with a tangible UI mockup.
'Built for a practice of two, not a hospital' sharpens the solution into a wedge.
After concrete product proof, this drops to six names and no metrics - the arc loses momentum.
Pricing is clear but arrives without CAC or churn to anchor it.
The 40% YoY footnote contradicts the plotted curve, and no practice count bridges to €18m.
Three credible channels, but it follows the forecast rather than preceding it and lacks funnel numbers.
Strong founder-market fit lands well, though placeholder portraits undercut it.
Coherent 2026-2028 arc, but funded vs post-Series A items are unmarked.
Specific €1.2m SAFE with €300k committed and a clear Series A trigger.
Memorable tagline but no explicit next step or recap metric.
Marlow is a well-grounded deck on the demand side - the problem is interview-validated across 38 practices, pricing is concrete, and the founding CEO is a practising physiotherapist - but the bias pattern clusters around unexamined upside.
The most damaging issues are Optimism Bias on Slide 9, where the plotted curve contradicts the stated 40% YoY assumption, Anchoring on a single €4.2bn unnamed-report TAM with no SAM/SOM, and Confirmation Bias expressed as the total absence of a competition slide in a category incumbents have served for twenty years.
Secondary Planning Fallacy and Expert Blind Spot signals show a team that models execution as technically solvable while under-specifying regulation, distribution economics (no CAC or LTV anywhere) and timeline risk.The fix is largely additive: bottom-up market math, a competitor map, unit economics, and a downside case.
Optimism Bias
high severityThe deck projects €18m ARR by 2030 from €0.1m in 2026 on only two stated assumptions, and the plotted curve (€0.9m → €3.4m → €9m → €18m) implies roughly 100%+ YoY growth, not the stated 40%. No churn, CAC or conversion driver supports the curve.
Investors who notice the internal contradiction between the stated 40% and the plotted curve will discount every other number in the deck, including the 400-practice milestone on the ask slide.
Rebuild Slide 9 bottom-up: practices added per month × €89 ARPA × retention, reconcile the curve with the stated growth rate, and add a downside case at 50% of plan showing runway impact.
9
Planning Fallacy
medium severitySix hires, a German localisation, insurer claim formats for three countries and 400 practices are all packed into 18 months with no stated buffer or dependency risk.
Experienced seed investors will see a roadmap-to-runway mismatch, suspecting a bridge round before the 2028 Series A.
On Slide 13, show a month-by-month milestone plan with the minimum ARR needed for Series A, and flag which roadmap items (e.g. marketplace for locum therapists) are explicitly deferrable.
12, 13
The deck's strongest asset is a credible founder-market fit team with a live product in 11 practices, but nearly every commercial claim rests on assertion rather than data.The three most vulnerable assumptions are: (1) the total absence of a competitive slide paired with the unevidenced claim that physios 'mostly do not' have software - investors will name three incumbents in Q&A; (2) the €18m ARR by 2030 curve, which has no bridge from €89 ARPU to ~17,000 practices and an 80% gross margin that ignores SMS, hosting and three-country insurer-format maintenance as real COGS; and (3) a traction slide of six text logos with zero metrics despite being live for months.
The pattern is a deck that substitutes named practices and tailwind narrative for unit economics and customer-evidence.Closing these requires a named competitor matrix with win/loss data, a bottom-up model (practices × ARPU × churn) replacing the top-down TAM, cohort metrics - MRR, trial-to-paid, churn, usage depth per practice, an early CAC and payback figure from the outbound motion, and an explicit GDPR / health-data and record-retention compliance plan for NL, DE and PL.
Evidence × Risk Matrix
7 assumptions plottedTop-left (low evidence + high risk) is the danger zone - these claims need validation first.
| # | Claim | Evidence | Gap Score | Risk | Category |
|---|---|---|---|---|---|
| 1 | Slide 4 implies no meaningful competition - physiotherapists, chiropractors and osteopaths 'mostly do not' have practice software, framing physio as the largest unserved segment | None provided - there is no competitive landscape slide in 14 slides, no named incumbent EU physio or practice-management vendor, and the 'mostly do not' assertion carries no citation or survey data | 92 | critical | competitive |
| 2 | Slide 9 projects a path to €18m ARR by 2030 on 40% YoY growth and an 80% gross margin at scale | A line chart with no y-axis and two assumption lines; no bridge from €89/practice/month to practice count (€18m implies roughly 17,000 practices), and SMS, hosting and support COGS are never quantified against the 80% margin | 88 | critical | financials |
| 3 | Slide 7 claims practices are 'trusted by leading practices' with 6 partners across 3 countries, and Slide 5 states live in 11 practices since March 2026 | Six practice names set as text, not logo artwork, plus one anonymous customer quote from Utrecht; zero metrics - no MRR, trial-to-paid conversion, churn, usage depth, or how many invoices actually flow through Marlow | 84 | critical | traction |
| 4 | Slide 4 sizes the opportunity at a €4.2bn TAM growing 11% a year for practice management software for healthcare practices in Europe | A single line citing an unnamed 'industry report, 2025'; the TAM explicitly spans dentists and GPs with existing incumbents, with no SAM or SOM narrowing to small physio practices | 78 | high | market |
| 5 | Slide 13 asks for €1.2m to reach 400 practices, with 35% to sales & marketing via outbound calls and 20-minute demos (Slide 10) | A funds-allocation bar chart and a note that four practices came by referral; no CAC, payback period, sales cycle length or close rate supports the 400-practice target | 76 | high | revenue |
| 6 | Slide 8 sets pricing at €89/practice/month for up to 4 therapists with SMS reminders included, no per-message fees, plus payment processing as a second revenue line in 2027 | Pricing structure is stated clearly, but the 38 practice interviews (Slide 2) evidence pain, not willingness to pay - no data on current software spend or why €89 rather than €49 or €149 | 70 | high | revenue |
| 7 | Slide 11 claims a complementary founding team: a physiotherapist CEO with eight years in a four-therapist Utrecht practice, a CTO who led a payments team at a Polish fintech and built v1 in six months, plus a consumer product designer | Specific, checkable operator backgrounds, a shipped live product in 11 practices, and named advisors - a former NL insurer claims director and an exited DE healthcare software founder; weakened only by placeholder portraits and no regulatory/GDPR owner named | 30 | medium | team |
Investor Questions & Answer Prep
Investor Q&A prep with what each question is really testing.
You have no competitive slide in 14 slides - name the three incumbents you lose deals to today, and tell me your win rate against each.
Whether you actually know the European physio practice-management landscape or built a product on an unverified assumption that the category is empty.
- Not in deck - named list of incumbent vendors by country (NL, PL, DE) with pricing and rough install base
- Not in deck - win/loss log from the demos run to date, including reason-for-loss tags
- Not in deck - what the 11 live practices switched from (paper, calendar app, spreadsheet, or a named competitor) - this is your strongest evidence
- Slide 2 and Slide 4 claims ('mostly do not' have software) backed by a source better than assertion
Acknowledge the missing competitive slide as a deck gap, not a knowledge gap, then immediately name specific vendors per market and state what each is weak at.Pivot to your real differentiator - that your displacement is mostly from paper and spreadsheets, evidenced by switch-from data across your live practices.
Close by committing to a named competitive matrix in the data room.
- x'There's really no one doing this for physiotherapists - the category is empty.'
- x'We haven't lost any deals yet' said without disclosing how few competitive deals have even occurred.
Your €18m ARR by 2030 at €89/month implies roughly 17,000 paying practices - walk me through the practice-count build, because 40% YoY growth is an output, not a plan.
Whether your model is built bottom-up from sales capacity or reverse-engineered from a venture-scale headline number.
- Not in deck - bottom-up build: practices per rep per month × reps hired per year × ramp time × churn
- Not in deck - total licensed practices per target country from public registries (your GTM on Slide 10 already cites these)
- Not in deck - blended ARPU assumption including the €19/extra-therapist expansion and annual-plan discount
- Slide 9 curve and Slide 13 hiring plan (three engineering, two sales, one support) reconciled against each other
Concede that Slide 9 shows an output curve and that the real plan is a capacity model, then walk the chain from reps × productivity × ramp × churn to practice count.Sense-check that count against total addressable practices per registry so the implied penetration is visibly defensible.
Offer the model spreadsheet rather than defending the headline.
- x'40% growth is conservative for SaaS at this stage.'
- xDiscovering the 17,000-practice implication live in the room and improvising the arithmetic.
You are live in 11 practices but show zero metrics - what is your MRR, your trial-to-paid conversion, and how many of the 11 are actually paying versus free or founder-network favours?
Whether 'live in 11 practices' is commercial traction or friendly pilots dressed as revenue.
- Not in deck - current MRR and the paying/free/discounted split across the 11 practices
- Not in deck - trial-to-paid conversion off the 30-day trial on Slide 8, with trial starts as denominator
- Not in deck - usage depth: notes written per therapist per week, invoices generated in-product, logins
- Not in deck - churn/retention since March 2026 and any practice that stopped using it
Lead with the exact paying-versus-free split before being pushed to it - volunteering the weaker number buys credibility.Then redirect to the metric that is genuinely strong at this stage, which is usage depth and retention, not revenue scale.
Frame Slide 7 as a logo slide that should have been a metrics slide and commit to replacing it.
- x'It's too early for metrics at 11 practices.'
- xCounting free pilots or founder-network practices as customers without disclosing it unprompted.
Of the 6 logos on Slide 7, how many are paying full price, and how many came through the CEO's own Utrecht network or founder relationships?
Whether your early demand is repeatable outside the founder's personal network - the core risk in founder-market-fit stories.
- Slide 7 - per-logo acquisition source (founder network, outbound cold, referral) and price paid
- Slide 10 claim that four practices came via referral - reconcile this with the logo list
- Not in deck - count of fully cold-sourced wins and the cold-outbound demo-to-close rate
- Not in deck - permission/reference status for each named practice
Answer the attribution question plainly and without hedging, since a network-heavy start is normal and even a strength given Anna's background on Slide 11.Then shift the burden of proof to the cold-sourced cohort, however small, as the real signal of repeatability.
State explicitly what cold conversion evidence the seed money is meant to buy.
- xVague framing like 'a mix of inbound and network' without naming the split.
- x'Our network is our moat' - treating non-repeatable access as defensibility.
You allocate 35% of €1.2m to sales for an outbound motion with no stated CAC - at €89/month, what CAC and payback period does a 20-minute-demo-to-close model actually produce?
Whether a low-ACV SMB product can survive a human-touch outbound motion, or whether unit economics break at scale.
- Not in deck - current fully-loaded CAC including founder selling time, and CAC payback in months
- Not in deck - funnel math: calls → demos booked → demos → closes from the Slide 10 motion
- Not in deck - LTV using observed or assumed churn and the €19/therapist expansion uplift
- Not in deck - rep quota and ramp assumptions underpinning the two sales hires on Slide 13
Acknowledge that ACV at this price point forces payback discipline, then show your current funnel conversion rates and resulting payback even if the sample is small. Explain how the mix shifts over time toward lower-cost channels - referrals and association partnerships on Slide 10 - and what CAC ceiling would cause you to stop scaling outbound.
- x'We'll figure out CAC after we hire the sales team.'
- xQuoting a CAC that excludes founder time, salaries or tooling as if it were fully loaded.
You hold patient clinical notes across NL, PL and DE and the deck never says GDPR, data residency, or national e-health certification - what is your current compliance posture, and who signed off on it?
Whether health-data regulatory exposure is a managed workstream or an unexamined liability that could block German entry entirely.
- Not in deck - GDPR Art. 9 processing basis, DPAs with practices, data residency/hosting region, sub-processor list
- Not in deck - German e-health certification requirements and timeline, with cost and engineering estimate
- Not in deck - record retention periods per country and breach/liability insurance status
- Slide 11 - what your former NL insurer claims director advisor has reviewed and signed off
Treat this as a competence question, not a checklist question: state your current posture crisply, name who reviewed it, then be honest about what is not yet in place.Convert the gap into a funded workstream with a named owner and a milestone tied to the German launch on Slide 12.
Reframe certification burden as a barrier to entry that favours a prepared entrant.
- x'We're GDPR compliant' with no named counsel, DPA, or hosting detail behind it.
- x'We'll handle certification when we get to Germany' - the market you've already priced into the plan.
Your 23-day invoice gap and 6h/week come from 38 interviews you ran yourself - how do you control for the fact that the CEO is a physiotherapist interviewing her own professional network?
Whether your foundational problem evidence is independently verifiable or a sophisticated form of confirmation bias.
- Slide 2 - interview methodology: recruitment source, how many were strangers versus known contacts, question script
- Not in deck - product-measured confirmation: actual visit-to-invoice gap observed in the 11 live practices before and after
- Not in deck - any third-party or association data corroborating admin burden in physiotherapy
- Not in deck - variance/distribution behind the averages, not just the headline figures
Accept the selection-bias critique as legitimate rather than defending the interviews, then show that the same numbers are now reproduced by in-product telemetry from live practices - observed data beats self-reported data.Note any independent corroboration and be explicit about which figure you hold most and least confidence in.
Position Anna's insider access as speed of access, validated externally.
- x'I'm a physiotherapist - I know this industry, the data is right.'
- xPresenting self-reported averages as hard metrics with no distribution or product-side confirmation.
SMS reminders with no per-message fees and three countries of insurer claim formats both sit inside an 80% gross margin assumption - show me the actual COGS per practice today.
Whether you understand that unmetered SMS, hosting, support and multi-format claim maintenance are structural margin leaks in a low-ACV product.
- Not in deck - actual COGS per practice per month today: SMS spend, hosting, support hours, payment fees
- Not in deck - SMS volume per practice per month and worst-case cost at heavy usage versus the €89 price
- Not in deck - engineering hours per quarter maintaining NL, PL and DE claim formats, and whether you treat that as COGS or R&D
- Slide 9 - current gross margin versus the 80%-at-scale assumption, with the bridge between them
Separate true COGS from the claim-format engineering tax and be explicit about where you classify each, since that classification is what the investor is actually testing.Give today's real per-practice cost, then show the levers that move it toward the Slide 9 assumption - SMS bundling caps, self-serve onboarding, support deflection.
Name the fair-use trigger that protects you from an outlier high-SMS practice.
- x'80% is standard for SaaS.'
- xClaiming SMS costs are negligible without a per-practice volume figure to back it.
If digital records become mandatory by 2027, what stops a national physiotherapy association or an insurer from funding a free compliant tool and eliminating your category overnight?
Whether your 'why now' tailwind on Slide 3 is actually a double-edged regulatory risk that could commoditise the compliance layer you're selling.
- Not in deck - precedent evidence: what happened in dentistry/GP when mandates landed in NL, PL, DE - did free tools win?
- Not in deck - your association partnership strategy (Slide 10) reframed as co-option rather than exposure
- Not in deck - the non-compliance value you deliver: scheduling, online booking, tablet notes, cash-flow speed, not just claim formats
- Slide 11 - what your ex-insurer claims director advisor says about insurer appetite to build and support software
Concede that compliance alone is not a moat and that mandates can commoditise the claim layer, then separate your value into the compliance layer versus the daily workflow layer where free tools historically underinvest.Cite precedent from adjacent professions and explain why associations partner rather than build.
Present your association strategy from Slide 10 as actively de-risking this scenario.
- x'Associations and insurers aren't software companies, they'd never build it.'
- xTreating the 2027 mandate purely as a tailwind with no downside case articulated.
Your roadmap adds patient payments, exercise plans and a locum marketplace by 2028 on six hires - which of these do you kill if Germany localisation takes twice as long as planned?
Whether you have focus and prioritisation discipline, or a roadmap written to impress rather than to be executed.
- Slide 12 - engineering effort estimate per roadmap item against the three engineering hires on Slide 13
- Not in deck - German localisation critical path: claim formats, certification, language, with a slip-risk assessment
- Not in deck - customer-demand evidence ranking the three roadmap items (requests from the 11 live practices)
- Not in deck - your revenue-per-engineering-hour ranking: which item protects retention versus which is optional
Answer the question directly by naming what you cut first and second - hesitation here reads as lack of conviction.Justify the ordering by retention impact and customer-requested demand, not by market size, and note that the locum marketplace and exercise plans compete with established players per the competitive gap.
Close by showing Germany is the gating milestone for Series A on Slide 13, so it wins any resource conflict by design.
- x'We'd find a way to do all of it - the team is efficient.'
- xDefending the locum marketplace as a core bet when no customer has asked for it.
Deck vs. Diagnostic
iIt is vertical B2B software for healthcare providers, handling clinical notes and insurer claims, which places it in healthtech/medtech despite being a pure SaaS model.
Slide Impact Matrix
iInvestor Objection Heatmap
iWhere investors will push back hardest. Longer bars mean more objections in that area.
Slide Heatmap
i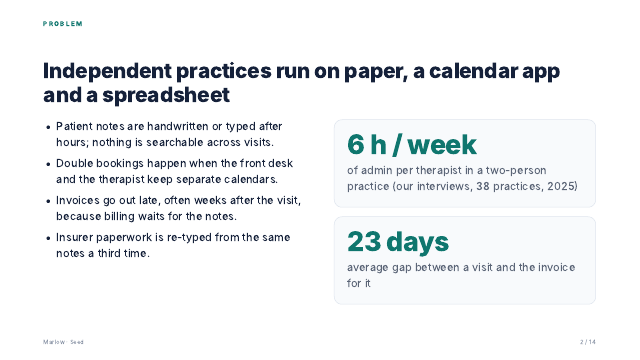

Metric Glossary
Plain-English definitions of the main report metrics.
A 0-100 investor-readiness score combining deck content, narrative clarity, visual quality, and fundraising risk signals.
Business Situational Awareness: how clearly the company understands the business, customer, and market environment behind the pitch.
Know Your Business, Know Your Customer, and Know Your Environment. These diagnose business model clarity, customer insight, and market context.
The share of report claims directly supported by content found in the deck. Lower values mean more inference or outside context.
A practical readiness label for the next fundraising conversation, based on blockers, evidence gaps, and stage fit.
The highest-leverage changes to make before the next investor conversation, ordered by likely impact.
A ranked view of where investors are most likely to push back: product, market, traction, competition, timing, team, or unit economics.
A map of slide execution quality versus investor importance. Low-quality, high-importance slides are the urgent fixes.
How smoothly the deck moves from problem to solution, market, traction, business model, team, and ask.
A simplified 2D view of how the startup is positioned against named competitors. AI-researched competitors should be verified.
 pitchera.ai
Scan to view this report on another device
AI-Powered Pitch Deck Analysisv0.33.107
Questions? [email protected]
Like what you see?
Get the same report for your own deck: $149, one payment, ready in about 25 minutes. 14-day money-back guarantee.
Get VC-Ready Audit for my deck →Not ready to pay? Start with the free review.
The problem is told through a credible workflow chain - handwritten notes, double bookings, late invoices, re-typed insurer paperwork - and the two quantified anchors (6h/week admin per therapist; 23 days average visit-to-invoice gap) are exactly what investors want.
The strongest asset is primary evidence from 38 practice interviews in 2025, which beats a cited analyst stat.The weakness is that pain is described in hours, never in euros, so the buyer's willingness to pay is left unproven.