Investor questions · Part 2
Does This Make Money on Every Customer?
The unit economics slide is the one founders most often leave out - and the question they get asked anyway. What investors are really checking, the four answers that end the meeting, and five steps to a number you can defend.
In this article
Investors do not ask about your unit economics because you have them. They ask because you don't.
That is not a guess. When our analysis was asked what each pitch deck was missing, unit economics came up more often than any other topic - four decks in five had nothing on what a customer costs to win or what that customer is worth. And when the same analysis wrote out the ten questions an investor would most likely put to each founder, this topic showed up in eight reports out of ten.
So it is the slide most likely to be missing, and the question most likely to come anyway. That combination is the whole reason this post exists.
Your TAM slide is not protecting you covered a topic founders include and still get audited on. This one is simpler and more brutal: the question you get because you left the slide out.
What does the question sound like?
Rarely as one sentence. Usually in pieces, over ten minutes, and the founder answers each piece separately without noticing it is all one question:
- "What does it cost you to get a customer?"
- "And what is that customer worth over time?"
- "What's your gross margin on a single one?"
- "How long until a customer pays back what it cost to win them?"
Put together: does this business make money on each customer - and how do you know?
What do investors actually want to hear?
At pre-seed nobody expects the number to be right. They know it is a guess. They are checking three things underneath it, and none of them is the figure itself.
Whether you know how customers actually arrive. A cost of acquisition implies a channel. "Our CAC is 400 euros" is not an answer until it becomes "outbound to clinic managers, about nine visits per signed practice, at this cost per visit." A founder with the number but not the channel has read a benchmark, not run a funnel.
Whether you think about one customer or about the market. This is the tell. Start from the market size and divide downward, and you get a plausible-looking CAC that has never been observed. Start from your last five customers and work upward, and you get an ugly number that is real. Investors prefer the ugly real one, every time.
Whether it makes money today, or only in a spreadsheet. Gross margin per customer is the part founders skip most, because it is the least flattering. A deck can have a revenue forecast, a pricing slide and a market size and still leave the reader unable to tell whether serving one more customer earns money or loses it.
The four answers that end the meeting
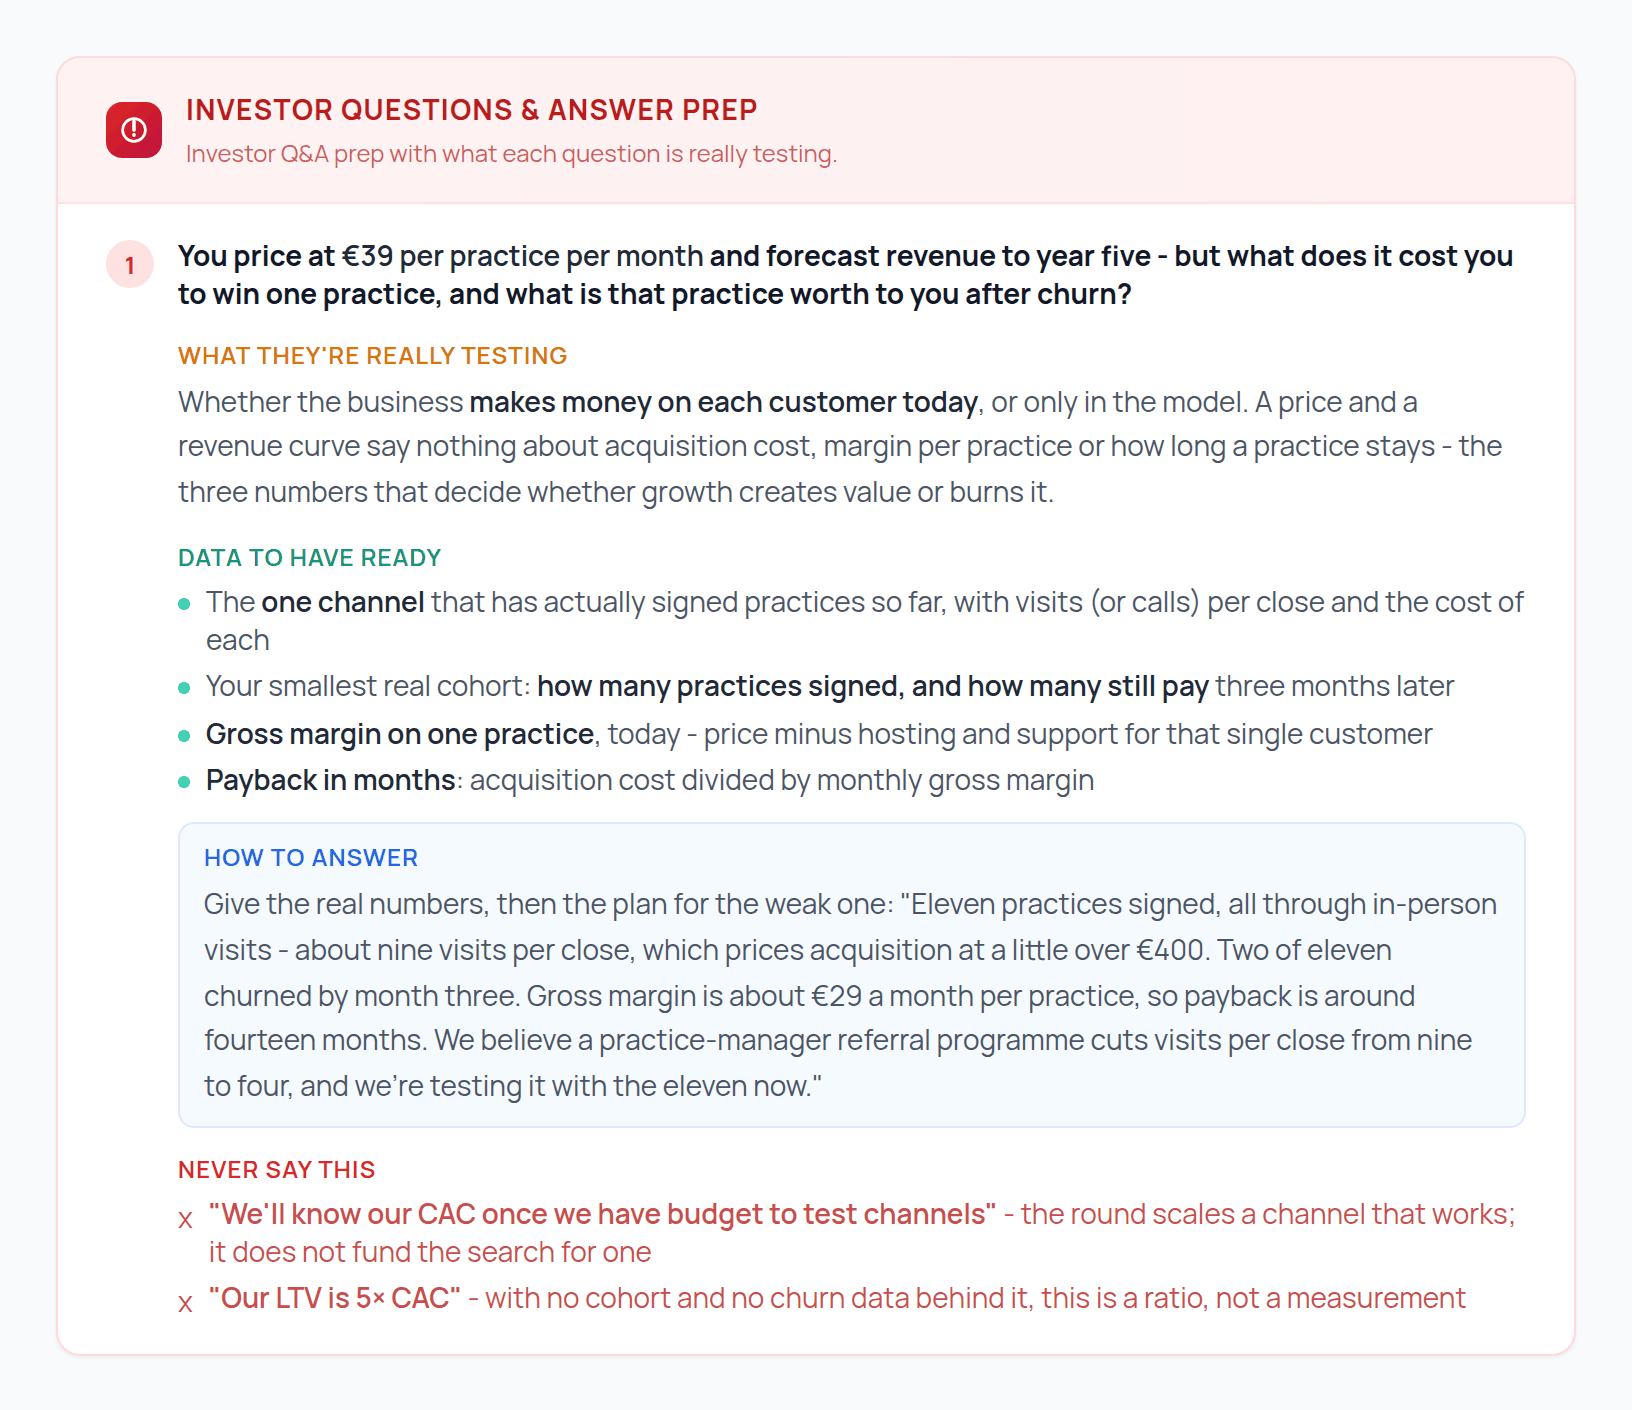
"We'll know our CAC once we have budget to test channels." This has the order backwards. The round funds scaling a channel that works - not the search for one. If you have not found it yet, say what you tried and what it cost, even at tiny scale, even by hand.
"Our LTV is five times our CAC." On its own, with no cohort behind it, this reads as a ratio copied from a blog post. Five-to-one needs a churn assumption; a churn assumption needs customers who have had time to churn. If you have three months of data, say three months and give the retention.
"Margins are thin now but will be 80% at scale." Everyone's margins improve at scale. The question is what they are today, per customer, and which specific cost falls as volume grows. "At scale" without a mechanism is a hope with a percentage attached.
A blended CAC that hides the paid channel. Averaging founder-led sales, referrals and paid acquisition into one number makes it look better than the channel you will actually spend the round on. The follow-up will be "split that out", so split it out first.
How to build the page
Five lines. Not a slide - a page in the appendix, and the numbers in your head.
1. Pick the one channel you would spend the round on, and price it. How many prospects it takes to close one customer, and what each prospect costs. If it is you, on the phone, price your own time. An honest hand-built channel beats a blank.
2. Take your smallest real cohort and count who is still paying. Five customers from March and how many are still there in June is worth more than a five-year LTV model. However small. Write the date and the number.
3. Gross margin on one customer, today. What they pay you minus what it costs to serve that one customer. Not the target, not the industry benchmark. Yours, now.
4. Divide. CAC from step one, divided by monthly gross margin from step three, gives payback in months. This is the number investors compare across their whole portfolio, and if you have done the first three steps you already have it.
5. Name the assumption you are least sure of. Every one of the numbers above rests on something you are guessing. Pointing at the guess before they do turns an interrogation into a conversation. "We think a referral programme cuts visits per close from nine to four - we're testing it now" is a stronger line than any total.
What does this look like in practice?
A pre-seed team we will call Marlow sells scheduling software to small physiotherapy practices. Their first deck had a pricing slide (39 euros per practice per month), a market slide, and a revenue curve to year five. The first question our analysis returned for that deck was the one above: what does it cost you to win one practice, and what is that practice worth?
As the deck stood, their answer would have been a market-sized guess.
Six weeks later they had a page. Eleven practices signed, all through the founder turning up in person - roughly nine visits per signed practice, about two hours each. Pricing that time modestly put acquisition at a little over 400 euros per practice. Two of the eleven had stopped paying by month three. Gross margin on one practice, after hosting and support, came to about 29 euros a month. Payback: fourteen months.
Fourteen months is not a good number. It is a real one - and the page that carried it also carried the sentence that changed the conversation: "We believe a practice-manager referral programme cuts visits per close from nine to four. We are testing it with the eleven now."
The question had an answer. The answer had a weakness. The weakness had a plan. That is the entire structure, and it is worth more than a spreadsheet that says 5× LTV.
Where this comes from
The "four in five" figure comes from 40 full readiness reports analysed between April and September 2026 - one per company, our own test uploads removed. Each report lists what the deck is missing; we sorted those notes by topic, and unit economics came first. The "eight in ten" figure comes from the 33 of those reports produced since our analysis was rebuilt in June 2026, each of which writes out ten investor-preparation questions tailored to that deck; we classified those by topic and counted how many reports raised each one. The questions come from our analysis of the deck, not from investors - they measure what a deck leaves open, not what a particular investor will say. The Marlow example is invented, in the shape of a real report.
Next
One topic came up more often than this one - in nine reports out of ten. It is about proof that someone outside the building actually wants what you are building. That is the next post.
If you want to see which questions your own deck would draw, the free deck review runs the same analysis and returns the three an investor is most likely to ask after reading it. No payment, no call.
Cite as: pitchera.ai, Does This Make Money on Every Customer?, 25 September 2026. Figures are aggregates; no company, file or deck excerpt from the sample is published.